
Karunya Institute of Technology and Sciences (KITS) undergoes regular energy reviews to identify the areas of the campus where energy waste is highest and to correct them on priority. In the academic year 2024-25 the reviews comprised:
- External energy audit: an energy audit of the campus by Nature Science Foundation (NSF), Coimbatore, an inspection body accredited by the National Accreditation Board for Certification Bodies (NABCB), conducted on 06 and 07 May 2025.
- Monthly consumption review: month-by-month recording of the electricity consumed by the campus from April 2024 to March 2025 by the Construction and Maintenance Department (CMD) and its comparison with 2023-24, reported to the Chief Engineer and consolidated for the Internal Quality Assurance Cell (IQAC) as required by the Energy and Carbon Management Policy.
These reviews are supported by the periodic statutory inspection of the HT electrical installation of the campus by the Electrical Inspectorate, Government of Tamil Nadu, under Regulation 32 of the Central Electricity Authority (Measures relating to Safety and Electric Supply) Regulations, 2023.
The reviews have identified the main sources of avoidable energy use on the campus – lighting, hostel water heating, water pumping, air-conditioning, computing, lifts and the ventilation of large halls – and a corrective measure has been assigned.
Table 1: Summary
| Item | Details |
|---|---|
| Indicator | 7.2.5 Energy wastage identification: undergo energy reviews to identify areas where energy waste is highest |
| Reporting period | Academic year 2024-25 (electricity data: April 2024 – March 2025) |
| Reviews in place | Yes. External energy audit on 06–07 May 2025; monthly review of electricity consumption for 2024-25; periodic statutory inspection of the electrical installation |
| External audit | Nature Science Foundation, Coimbatore (NABCB-accredited inspection body, Reg. No. IB 121). Inspection Certificate No. NSF/PR/7.4.2/01 issued on 15 May 2025, valid until 05 May 2027 |
| Policy basis | Energy and Carbon Management Policy (KITS/ECMP/2025/01), Articles 3.1 and 5.1–5.4; Climate Change Mitigation and Sustainability Policy (KITS/CCMSP/2025/01), Article 2; Carbon Reduction Target & Net Zero Commitment |
| Electricity use, 2024-25 | 62,07,259 kWh, 8.0% lower than in 2023-24 (67,48,167 kWh) |
1. Policy requiring annual energy reviews
Energy reviews at KITS are required by institutional policies that have been in place since July 2022 and were last revised on 29 August 2025 at the 28th meeting of the IQAC, and by the Institute’s Carbon Reduction Target & Net Zero Commitment. The relevant provisions are reproduced in Table 2.
Table 2: Policy provisions on energy reviews
| Policy and clause | Provision |
|---|---|
| Energy and Carbon Management Policy (KITS/ECMP/2025/01), Article 3.1 – Energy Conservation | “KITS shall prioritize energy-efficient practices in lighting, cooling, heating, and equipment usage. Energy audits shall be conducted annually to identify areas of wastage, and corrective measures shall be implemented promptly.” |
| ECMP, Article 5.1 – Identification of Deficiencies | “Deficiencies in energy management, such as high consumption zones, equipment inefficiencies, or poor compliance, shall be identified through audits, IoT-based monitoring, and stakeholder feedback.” |
| ECMP, Article 5.2 – Reporting Mechanism | “Divisions must submit quarterly energy consumption reports to the Chief Engineer, who shall consolidate findings for IQAC. Any non-compliance or abnormal usage shall be escalated to the Registrar and Vice-Chancellor.” |
| ECMP, Articles 5.3 and 5.4 – Corrective Measures; Outcomes and Documentation | “Issues identified shall be classified as minor (quick fixes), major (requiring infrastructure upgrade), or critical (requiring immediate management action). Corrective timelines and responsibilities shall be assigned.” “All corrective actions shall be documented in an institutional Energy & Carbon Register. The outcomes shall be verified in subsequent audits to ensure accountability and continuous improvement.” |
| Climate Change Mitigation and Sustainability Policy (KITS/CCMSP/2025/01), Article 2 | “Conduct annual energy and carbon footprint audits to assess performance and guide corrective actions.” |
| Carbon Reduction Target & Net Zero Commitment – reduction of campus energy intensity through audits, smart meters and energy-efficient infrastructure | “KITS contributes institutionally by reducing energy use per student, per research output, and per built-space through annual audits, digital energy monitoring, optimization, and green infrastructure development.” |
2. External energy audit by an accredited inspection body (May 2025)
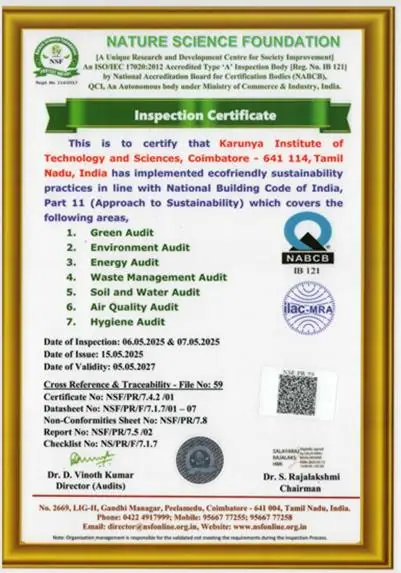
The external energy audit for 2024-25 was conducted on 06 and 07 May 2025 by Nature Science Foundation (NSF), Coimbatore, an ISO/IEC 17020:2012 accredited Type ‘A’ Inspection Body (Reg. No. IB 121) accredited by the National Accreditation Board for Certification Bodies (NABCB), Quality Council of India. The energy audit formed part of a seven-area sustainability inspection carried out against the National Building Code of India, Part 11 (Approach to Sustainability). On completion of the audit, NSF issued its Inspection Certificate to KITS on 15 May 2025, valid until 05 May 2027 (Figure 1).
Table 3: Particulars of the external audit
| Particular | Details |
|---|---|
| Audit body | Nature Science Foundation, Coimbatore |
| Accreditation | ISO/IEC 17020:2012 accredited Type ‘A’ Inspection Body, Reg. No. IB 121, National Accreditation Board for Certification Bodies (NABCB), Quality Council of India |
| Areas audited | Green Audit, Environment Audit, Energy Audit, Waste Management Audit, Soil and Water Audit, Air Quality Audit and Hygiene Audit |
| Reference standard | National Building Code of India, Part 11 (Approach to Sustainability) |
| Dates of inspection | 06.05.2025 and 07.05.2025 |
| Certificate and report | Certificate No. NSF/PR/7.4.2/01; Report No. NSF/PR/7.5/02; Non-Conformities Sheet No. NSF/PR/7.8 (File No. 59) |
| Date of issue and validity | Issued on 15.05.2025; valid until 05.05.2027 |
3. Monthly review of electricity consumption, 2024-25
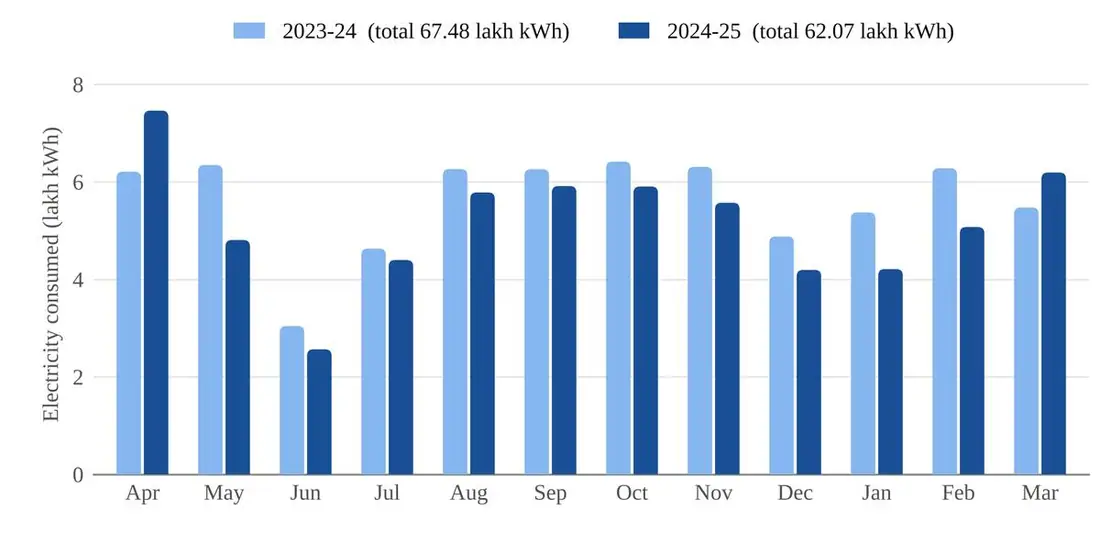
The Construction and Maintenance Department records the electricity consumed by the campus every month, including power drawn from the grid (EB) and generated by the diesel generator sets. Table 4 and Figure 2 compare the monthly consumption from April 2024 to March 2025 with the same months of 2023-24.
Table 4: Monthly electricity consumption, 2023-24 and 2024-25
| Month | 2023-24 (kWh) | 2024-25 (kWh) | Change |
|---|---|---|---|
| April | 6,20,978 | 7,46,085 | +20.1% |
| May | 6,34,642 | 4,80,703 | −24.3% |
| June | 3,04,255 | 2,56,510 | −15.7% |
| July | 4,63,100 | 4,39,643 | −5.1% |
| August | 6,26,315 | 5,78,334 | −7.7% |
| September | 6,26,004 | 5,91,350 | −5.5% |
| October | 6,41,491 | 5,90,424 | −8.0% |
| November | 6,30,763 | 5,57,192 | −11.7% |
| December | 4,87,955 | 4,19,402 | −14.0% |
| January | 5,37,387 | 4,21,066 | −21.6% |
| February | 6,27,956 | 5,07,400 | −19.2% |
| March | 5,47,321 | 6,19,150 | +13.1% |
| Total | 67,48,167 | 62,07,259 | −8.0% |
Key findings of the 2024-25 review:
- Annual consumption fell by 5,40,908 kWh (8.0%), from 67,48,167 kWh in 2023-24 to 62,07,259 kWh in 2024-25.
- Consumption was lower in ten of the twelve months. Only April 2024 (+20.1%) and March 2025 (+13.1%) were higher than the same months of 2023-24.
- Monthly demand was highest in April 2024 (7,46,085 kWh) and lowest in June 2024 (2,56,510 kWh).
- In 2024–25, the campus consumed 806.14 kWh of grid electricity per capita (campus population: 7,700) and 25.40 kWh/m² across 2,44,340 m² of institutional built-up area.
4. Areas of highest energy waste identified and corrective measures
The audit and consumption reviews have identified the following areas as the main sources of energy waste on the campus. A corrective measure has been assigned to each, and the measures are being implemented in phases. Table 5 gives the status in 2024-25.
Table 5: Areas of energy waste, corrective measures and status in 2024-25
| No. | Area of energy waste identified | Corrective measure | Status in 2024-25 |
|---|---|---|---|
| 1 | Lighting: conventional 40 W tube lights and conventional street lights | Replacement with 18 W LED tube lights and LED street lights | 97% converted; 15,066 fluorescent tube lights retrofitted with LED tube lights (within an overall institutional deployment of 15,288 LED luminaires across campus). |
| 2 | Water heating in the hostels using electric or fossil-fuel heaters | Solar water heating systems | 87,600 litres per day installed; 15,45,718 kWh of energy saved per year |
| 3 | Water pumping: motors and pumps | Wireless water-level controllers and capacitors for energy savings | 95% of motors and pumps covered |
| 4 | Air-conditioning | Star-rated air conditioners with energy-saving compressors | 65% of air conditioners star-rated |
| 5 | Computers and servers | Energy-efficient computers; server consolidation and desktop virtualisation | 55% of computers energy-efficient; 67 virtual servers run on 6 physical machines |
| 6 | Passenger and goods lifts | Energy-efficient lifts | 65% of lifts energy-efficient |
| 7 | Lights left on in unoccupied spaces | Automatic lighting control with motion sensors and ambient-light detectors, with ICT-based scheduling and remote monitoring | Deployed in various academic and administrative buildings |
| 8 | Ventilation of auditoriums and other large spaces with many conventional fans | High Volume Low Speed (HVLS) fans | Installed in auditoriums |
| 9 | Heat and energy loss in conventional fan regulators | Electronic fan regulators | Replaced across the campus |
| 10 | Occupant behaviour: lights and fans left switched on | “Save Energy” badges near switchboards | Placed in classrooms, offices and hostels |
Table 6 quantifies the saving from the lighting retrofit by comparing the conventional fittings with the LED fittings that replaced them.
Table 6: Lighting retrofit – conventional tube lights replaced with LED tube lights
| Parameter | Conventional fittings | LED fittings |
|---|---|---|
| Power per fitting | 40 W | 18 W |
| Number of fittings | 15,066 | 15,066 |
| Energy use per day | 4,821 units | 2,169 units |
| Energy use per year | 15,66,825 units | 7,04,925 units |
| Illumination level | 95 lux | 150 lux |
| Electricity charges per year | ₹. 1,48,84,837 | ₹. 66,96,787 |
| Maintenance | Rs. 45,000 per year | Replacement warranty up to 3 years |
| Saving per year | – | 8,61,900 units; Rs. 81,88,050 |
5. Outcome and next steps
Corrective measures arising from the reviews are producing measurable savings: in 2024-25 the LED retrofit avoided 8,61,900 units of electricity and Rs. 81,88,050 in electricity charges, the solar water heaters saved 15,45,718 kWh of energy, and total campus electricity consumption was 8.0% lower than in 2023-24. The Institute’s policies set the following next steps:
- Annual energy and carbon footprint audits to assess performance and guide corrective actions (Climate Change Mitigation and Sustainability Policy, Article 2).
- Smart meters, digital energy monitoring and optimisation to reduce energy use per student, per research output and per built-up area (Carbon Reduction Target & Net Zero Commitment).
- Energy-efficient lighting, HVAC and sensors, and smart campus initiatives using Industry 4.0 technologies (Climate Change Mitigation and Sustainability Policy, Article 3.2).
- Installation of 1 MW of solar power by 2027 to meet the major daytime academic energy demand and reduce the institutional carbon footprint by 30% (Climate Change Mitigation and Sustainability Policy, Article 2).
Through these reviews, KITS identifies where energy is being wasted, acts on those areas and verifies the results in the next year’s audit and consumption review, in support of its commitment to Net Zero emissions by 2040.